Business token usage: the full research
Reference page. Prepared 17 October 2026 (CEST). The short version of this research is the blog post "Agents read 1,142 tokens for every token they write, and premium models bill the most for each one".
Business AI usage is splitting in two. Token volume is moving to cheaper models. Spending is not moving with it, because the work that matters most to businesses still runs on premium models, and buyers of that work pay little attention to price. For anyone trying to control an AI budget, that split decides where waste costs the most.
Tokens are moving down-market
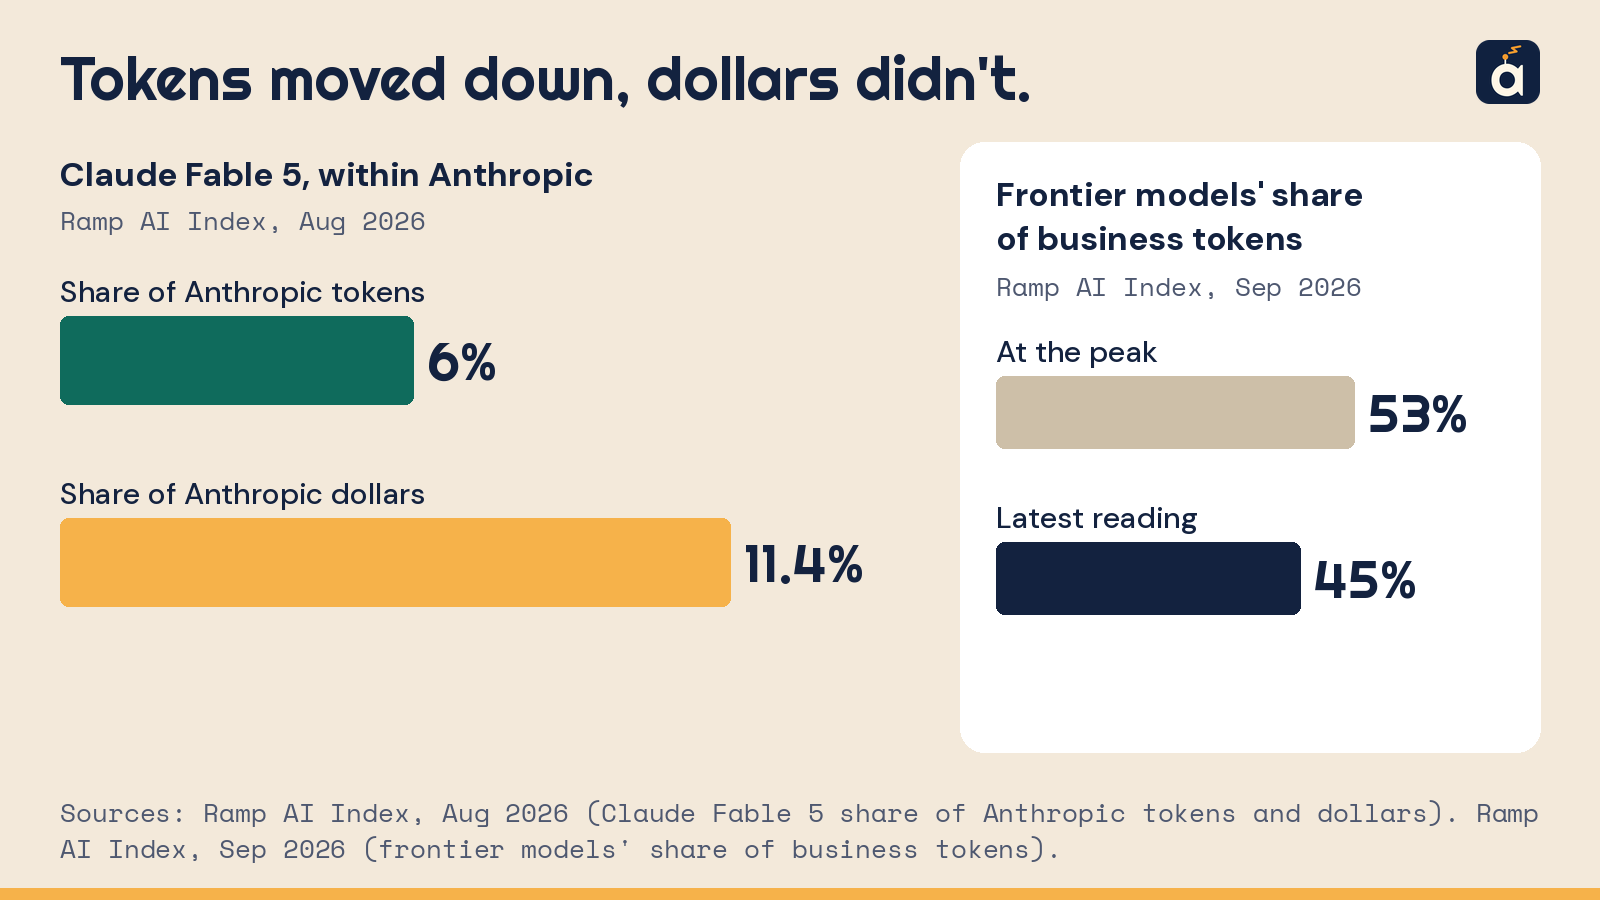
Ramp's AI Index tracks card and bill-pay spending at more than 70,000 US businesses. In its September 2026 letter, frontier models (the Opus, Fable and Sol tiers) accounted for 45% of the tokens businesses bought, down from a peak of 53% in August.
Ramp reports that the growth in volume is coming from "relatively cheap, standard models" and that some businesses are "imposing company-wide defaults that reduce usage of frontier models". Ramp's index of the effective price per million tokens fell 41% from its March peak, to $0.68.
The October index adds a second signal. Token volumes rose while token spending stayed flat. Businesses are buying more tokens for the same money.
The developer market shows the same pattern more sharply. On OpenRouter's public leaderboard, most of the ten most-used models by weekly tokens are low-priced "Flash"-class models. The top model, DeepSeek V4.1 Flash, processed 36.8 trillion tokens in the week to 16 October 2026. OpenRouter and a16z found that open-weight models reached roughly one-third of OpenRouter usage by late 2025.
The money stays on premium models
Dollar share tells a different story.
In Ramp's August 2026 index, Anthropic's Fable 5 was 6% of the Anthropic tokens businesses bought but 11.4% of the Anthropic dollars. Menlo Ventures estimated that Anthropic, OpenAI and Google together took 88% of enterprise model API spending in 2025. Over the same period, the open-source share of enterprise usage fell from 19% to 11%.
The reason is that demand responds little to price.
- OpenRouter and a16z describe usage as "relatively price-inelastic": a 10% price cut corresponds to only about 0.5% to 0.7% more usage. Proprietary models sit in what they call the "high-cost, high-usage zone".
- Anthropic's Economic Index (September 2025) found that among enterprise API customers, the most-used tasks tend to cost more. After controlling for task type, a 1% increase in cost was associated with only a 0.29% fall in usage. Anthropic called this "weak price sensitivity".
- Spending is also highly concentrated. Ramp reports that 80% of OpenAI and Anthropic spending on its platform comes from 1% of firms.
The split follows the workload
Coding and agent work stays on premium models. Menlo Ventures put Anthropic's share of the enterprise coding market at 54%, against 21% for OpenAI. OpenRouter and a16z place technology and science workloads in their "premium" category: high cost and high usage.
Bulk work goes the other way. In the words of the OpenRouter study, closed models "capture high value tasks, while open source models capture high volume lower value tasks".
This matters for waste. The workloads that send the most input to a model, coding agents and multi-step agents, are the same workloads that run on the most expensive models.
Where business tokens leak
Agents read far more than they write.
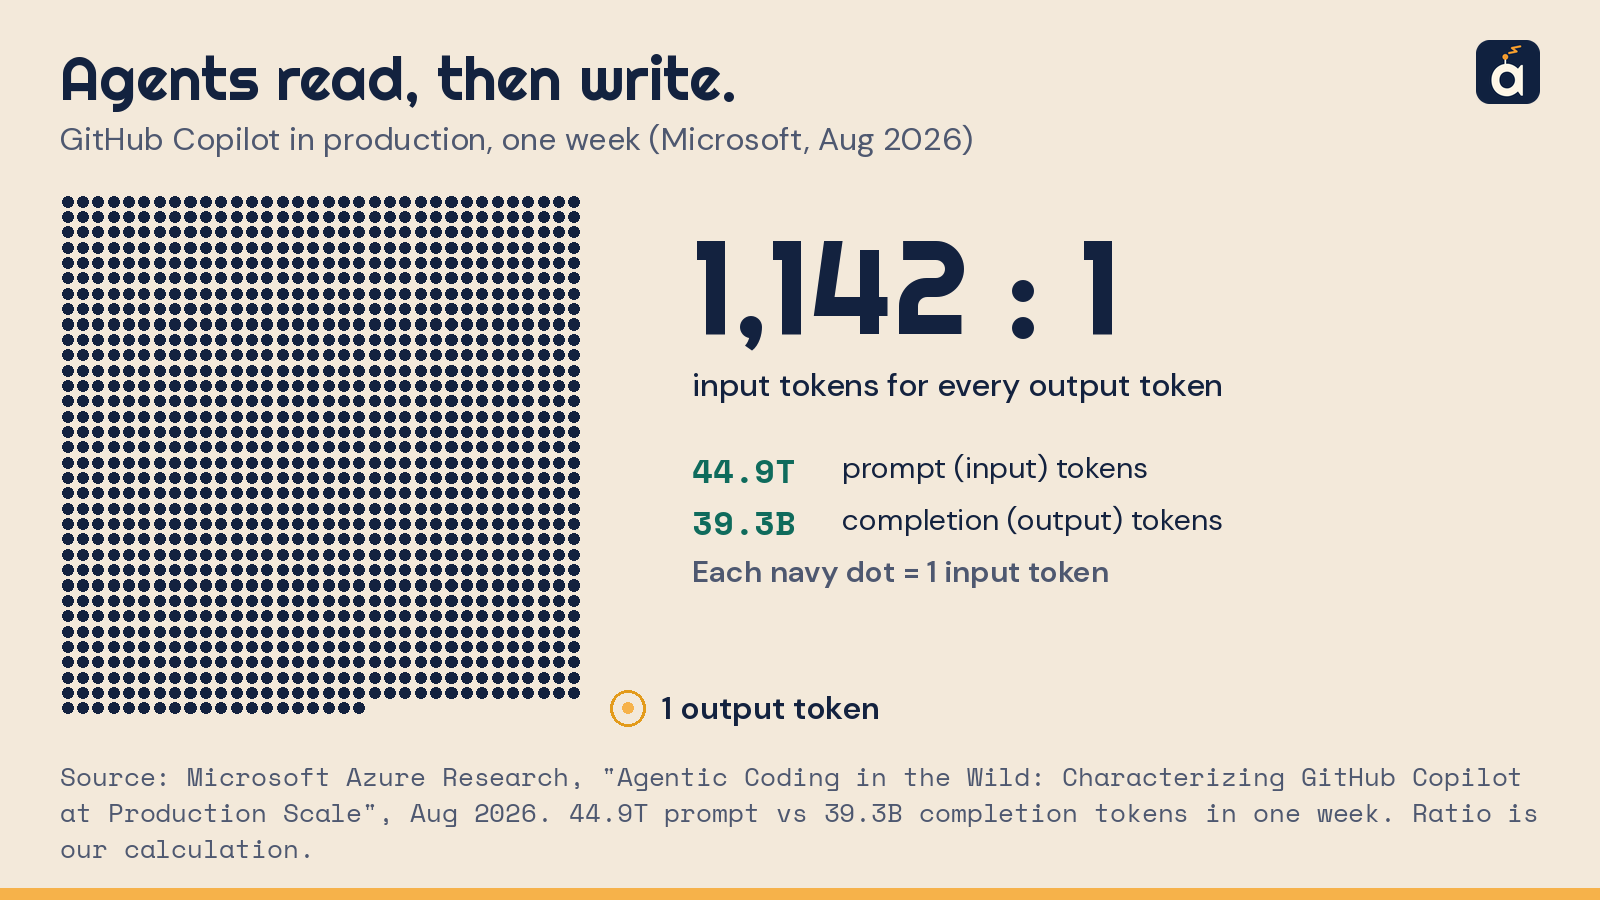
- Microsoft's study of GitHub Copilot in production counted 44.9 trillion prompt tokens against 39.3 billion completion tokens in one week. That is about 1,142 input tokens for every output token calc.
- The median agent turn carried 227,600 prompt tokens.
- Prefix caching covered about 90% of tokens within a session. The hit rate fell to 55% at turn boundaries and to 8% after a model switch.
Several measured sources of excess input stand out.
Agent structure. Anthropic reported in June 2025 that agents use about 4 times the tokens of chat, and multi-agent systems about 15 times. Its early multi-agent failures included "spawning 50 subagents for simple queries".
Retries. In the Copilot traces, tool failures occurred in 9% of turns. The retry loops that followed amplified compute by up to 4 times.
Tool definitions. Anthropic measured about 55,000 tokens of tool definitions in a five-server MCP setup before any work began, and has seen 134,000. Its tool search feature cut that by 85%. In a separate example, moving tool use into code execution reduced tool-definition tokens from 150,000 to 2,000.
Agent history. A 2025 study of agent trajectories (Xiao et al., "AgentDiet") found useless, redundant and expired information to be widespread. Removing it cut input tokens by 39.9% to 59.7% and total cost by 21.1% to 35.9%, with no loss in task performance.
Raw formats. HTML markup carries little meaning for a model but costs tokens. Cloudflare reported that its own announcement post was 16,180 tokens as HTML and 3,150 as Markdown, an 80% reduction.
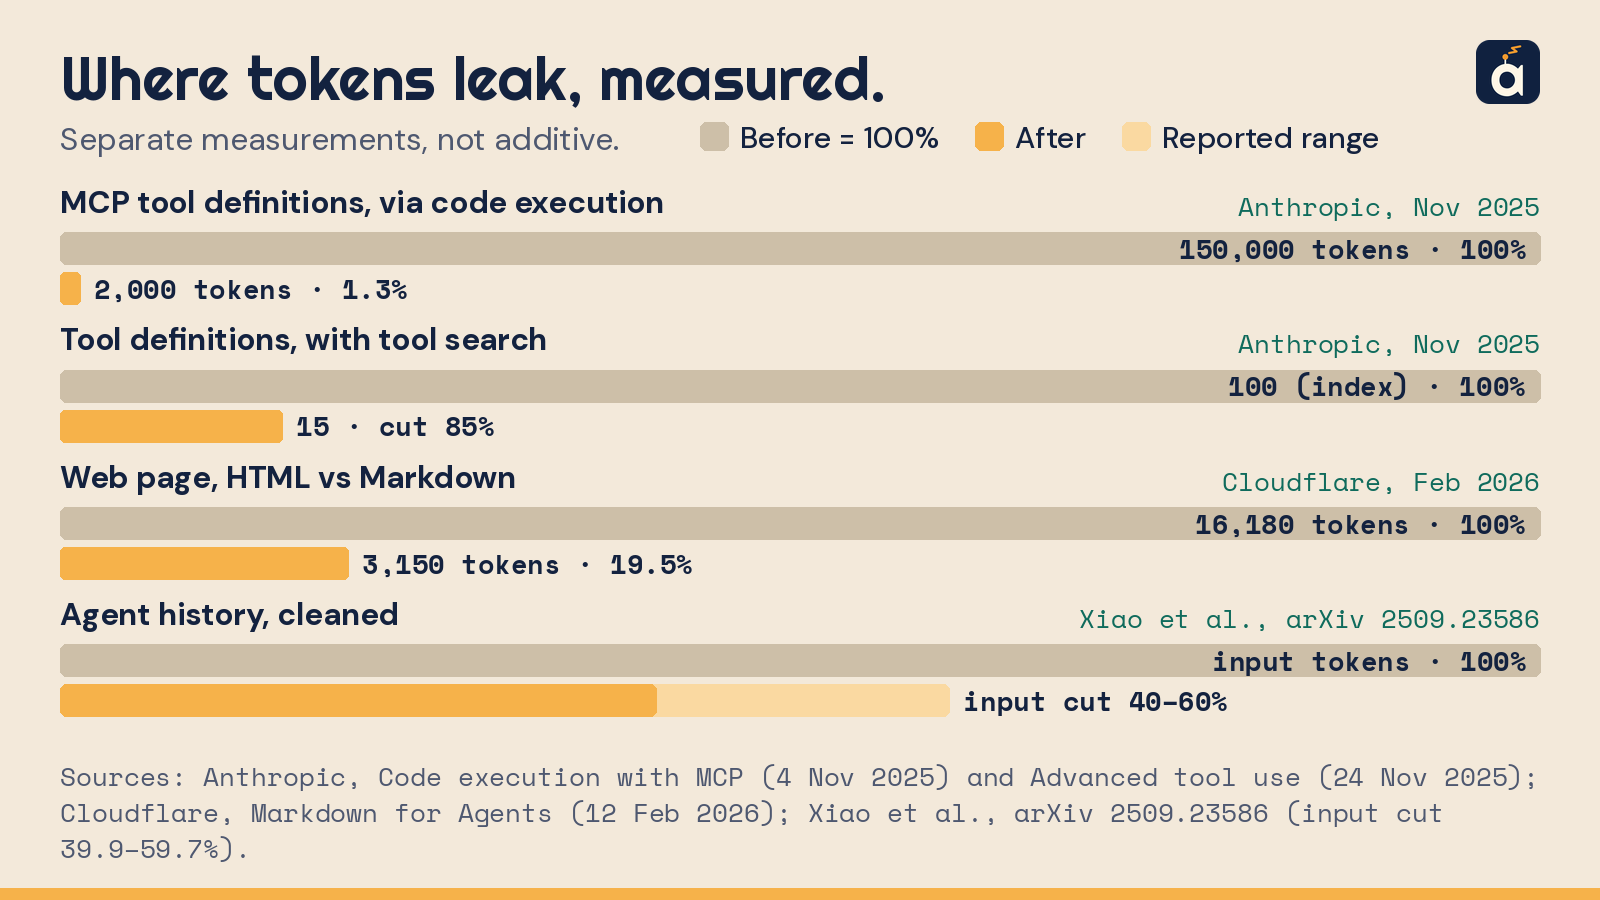
These figures come from different workloads and should not be added together. No public dataset measures what share of all business tokens is excess.
Excess input also has a quality cost. Chroma tested 18 models and found that performance falls as input length grows, even on simple tasks.
Wasted input costs the most on premium models
On OpenRouter's public price list (fetched 17 October 2026), input prices per million tokens run from $0.0161 for DeepSeek V4.1 Flash to $30 for GPT-5.5 Pro. On input price, GPT-5.5 Pro costs about 1,863 times as much as DeepSeek V4.1 Flash, Claude Fable 5.1 about 621 times, and Claude Opus 5.5 about 248 times calc.
Because premium models receive the agent and coding work, the same excess token costs the most where it is most likely to appear.
A worked example uses Cloudflare's figure calc. Its page as HTML carried 13,030 more tokens than the Markdown version. One uncached read of those 13,030 tokens costs:
- GPT-5.5 Pro ($30/M): $0.39
- Claude Fable 5.1 ($10/M): $0.13
- Claude Opus 5.5 ($4/M): $0.052
- Claude Sonnet 5.5 or GPT-6 Sol ($2/M): $0.026
- Claude Haiku 4.5 ($1/M): $0.013
- DeepSeek V4.1 Flash ($0.0161/M): $0.0002
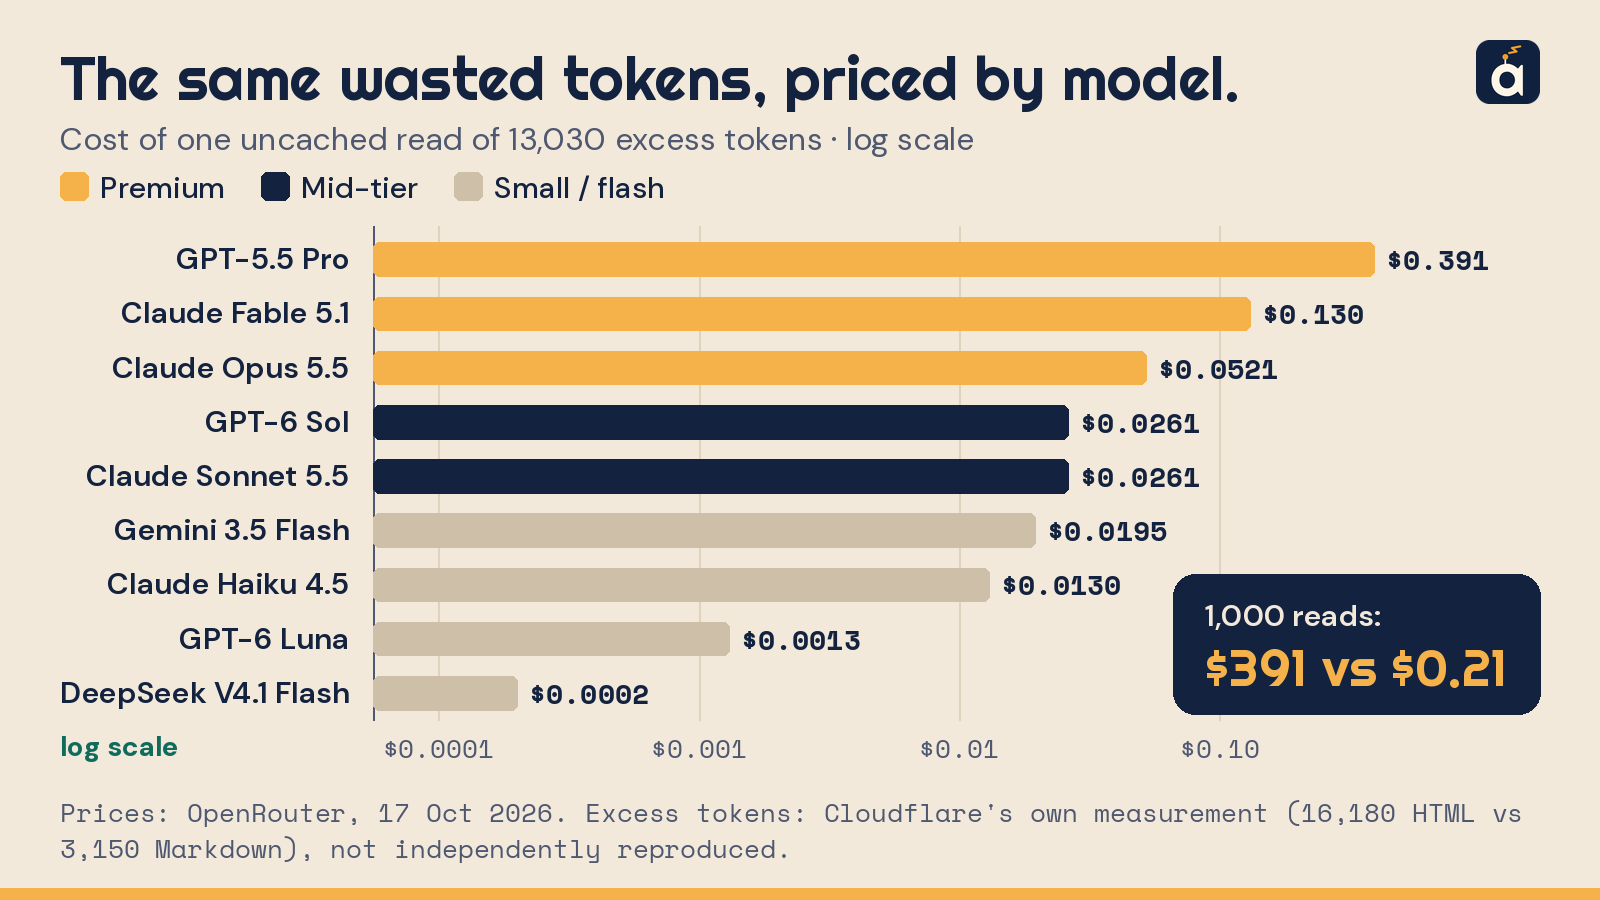
Across 1,000 such reads, that is $391 on GPT-5.5 Pro and $0.21 on DeepSeek V4.1 Flash calc.
Content that stays in an agent's context is billed again on later calls. Cached input costs less, typically around 10% of the input rate, and the full rate applies again whenever the cache breaks. So a single read is the minimum cost, not the typical one.
The same arithmetic shows the limit. On the cheapest models, removing these tokens saves fractions of a cent. There, the argument for shorter input is context quality, not price.
What efficiency has already fixed
A great deal has already improved.
- Epoch AI estimates that the price of a fixed level of model performance has been falling about 13 times per year.
- Prompt caching cuts the cost of repeated input by up to 90%.
- Routing sends simpler requests to cheaper models, and Ramp's data shows businesses doing so.
- Tool search and code execution shrink tool definitions.
None of these changes what a tool returns to the model. Caching makes repeated tokens cheaper but still bills them. Routing changes which model reads the input, not how much input there is. And lower prices have been followed by higher volumes: Ramp's October data shows more tokens for the same spending.
Where pay-per-use shortcuts fit
A pay-per-use shortcut is a single paid call for a specific job, such as converting a page to clean text, extracting a table from a PDF or summarising a repository. It does the bulk part of that job with plain code or a small specialist model, and returns a shorter result for the premium model to read. The premium model then spends its expensive input on the part of the task that needs it.
How much this saves depends on what the agent would otherwise have read.
- If the agent would have read raw HTML, a full PDF or a whole repository, the gap can be large. Cloudflare's 80% figure for HTML against Markdown gives a sense of scale.
- If the agent's fetch tool already strips a page to its visible text, a page shortcut adds little, because most of the reduction has already happened.
- On low-priced models, the shortcut's own fee can exceed the token cost it avoids.
The case is strongest where premium models read large, unprocessed inputs, and weakest where inputs are already clean or the model is cheap.
Amazap sells shortcuts of this kind, priced per call in sats with no subscription. They map onto the leaks above:
- Failed CI logs: Log Squeezer shrinks a failed CI log before the model reads it.
- Library and API documentation: Docs Digest returns an outline, signatures and examples from large multi-page documentation sites. API Spec Digest turns an OpenAPI or Swagger spec into a compact endpoint index.
- Repositories: Repo Digest returns a repository's description, tree, short README, entry points and recent commits, so an agent does not read it file by file.
- Packages: Package Facts returns one npm or PyPI package's advisories, deprecations and upgrade path.
- PDFs: PDF reading converts a PDF to Markdown. Its output is about the size of pdftotext output, so it helps only agents that cannot run a local converter.
These are the inputs that are large and unprocessed by default, where the Cloudflare-style gap is most likely. We do not publish our own savings figures here yet. We will publish them, with the method, once they are measured against the clean-text baseline an ordinary agent fetch tool would produce.
Method notes
- Prices. Input prices come from OpenRouter's public models endpoint (https://openrouter.ai/api/v1/models), fetched 17 October 2026 at 12:22 CEST, in USD per million tokens. No account was used. Prices change often, so recheck them before publication.
- Calculations. Everything marked calc is our own arithmetic on the cited figures:
- Input-to-output ratio: 44.9T ÷ 39.3B ≈ 1,142. - Price ratios: $30 ÷ $0.0161 ≈ 1,863; $10 ÷ $0.0161 ≈ 621; $4 ÷ $0.0161 ≈ 248. - Worked example: (16,180 − 3,150) × price per token, for one uncached read and for 1,000 reads.
- Cloudflare figure. The 16,180 and 3,150 token counts are Cloudflare's own measurement of its launch post (12 February 2026). We could not reproduce the 16,180 figure from the page as it is published today. The figure applies only when an agent would otherwise feed raw HTML to the model.
- Not additive. The leak figures come from different workloads (Copilot coding, Anthropic research agents, benchmark trajectories). They should not be added up into one share of "wasted" tokens. No public dataset measures that share.
- Amazap figures. This page contains no Amazap savings figures. They will be published, with the method, once they are measured against the clean-text baseline an ordinary agent fetch tool produces.
- Dates. Some sources are dated only to the month or year: the Microsoft Copilot paper (August 2026, from its URL), the Ramp index posts, Chroma's Context Rot (July 2025) and Epoch AI's 2026 report.
Chart specs (to be produced)
Chart 1. The input bill: price per million input tokens, and the cost of one 13,030-token excess
- Type: horizontal bar chart, log-scale x-axis. Each bar is labelled with the cost of one uncached read of 13,030 tokens.
- Data: OpenRouter /api/v1/models, fetched 2026-10-17 12:22 CEST. Excess tokens = 16,180 − 3,150 (Cloudflare, 12 Feb 2026) calc.
| Model | Input $/M | Cost of 13,030 tokens calc |
|---|---|---|
| openai/gpt-5.5-pro | 30.00 | $0.391 |
| anthropic/claude-fable-5.1 | 10.00 | $0.130 |
| anthropic/claude-opus-5.5 | 4.00 | $0.0521 |
| openai/gpt-6-sol | 2.00 | $0.0261 |
| anthropic/claude-sonnet-5.5 | 2.00 | $0.0261 |
| google/gemini-3.5-flash | 1.50 | $0.0195 |
| anthropic/claude-haiku-4.5 | 1.00 | $0.0130 |
| openai/gpt-6-luna | 0.10 | $0.0013 |
| deepseek/deepseek-v4.1-flash | 0.0161 | $0.0002 |
- Footnote: "Cost of one uncached read. Cloudflare's own measurement of its launch post; not independently reproduced."
Chart 2. Token share vs dollar share
- Type: paired bars per model (token share vs spend share within the vendor), plus an inset line showing frontier share of business tokens.
- Data, Ramp AI Index, August 2026 (July data), https://ramp.com/data/ai-index-august-2026:
- Claude Fable 5: 6% of Anthropic tokens, 11.4% of Anthropic dollars - GPT-5.6 Sol: 25% of OpenAI tokens, 23% of OpenAI dollars
- Inset data, Ramp AI Index, September 2026, https://ramp.com/data/ai-index-sept-2026: frontier share of business tokens 53% at the August peak, 45% in the latest reading. Plot only these two stated points.
Sources
- Ramp, AI Index, August 2026: https://ramp.com/data/ai-index-august-2026
- Ramp, AI Index, September 2026: https://ramp.com/data/ai-index-sept-2026
- Ramp, AI Index, October 2026: https://ramp.com/data/ai-index-oct-2026
- OpenRouter, Rankings (data through 16 Oct 2026, accessed 17 Oct 2026, CC BY 4.0): https://openrouter.ai/rankings
- OpenRouter, models and prices API (fetched 17 Oct 2026, 12:22 CEST): https://openrouter.ai/api/v1/models
- OpenRouter and a16z, State of AI: an empirical 100 trillion token study (4 Dec 2025; arXiv 2601.10088, Jan 2026): https://openrouter.ai/state-of-ai and https://arxiv.org/abs/2601.10088
- Anthropic, Economic Index report, 15 Sep 2025: https://www.anthropic.com/research/anthropic-economic-index-september-2025-report
- Menlo Ventures, 2025: The State of Generative AI in the Enterprise, 9 Dec 2025: https://menlovc.com/perspective/2025-the-state-of-generative-ai-in-the-enterprise/
- Microsoft Azure Research, Agentic Coding in the Wild: Characterizing GitHub Copilot at Production Scale (Aug 2026): https://www.microsoft.com/en-us/research/wp-content/uploads/2026/08/ghcp_traces-6.pdf
- Anthropic, How we built our multi-agent research system, 13 Jun 2025: https://www.anthropic.com/engineering/multi-agent-research-system
- Anthropic, Advanced tool use, 24 Nov 2025: https://www.anthropic.com/engineering/advanced-tool-use
- Anthropic, Code execution with MCP, 4 Nov 2025: https://www.anthropic.com/engineering/code-execution-with-mcp
- Anthropic, Prompt caching, 14 Aug 2024: https://www.anthropic.com/news/prompt-caching
- Xiao et al., Reducing Cost of LLM Agents with Trajectory Reduction, arXiv 28 Sep 2025 (rev. 15 Mar 2026): https://arxiv.org/abs/2509.23586
- Cloudflare, Markdown for Agents, 12 Feb 2026: https://blog.cloudflare.com/markdown-for-agents/
- Chroma Research, Context Rot, Jul 2025: https://research.trychroma.com/context-rot
- Epoch AI, The plunging price of thought (2026): https://epoch.ai/publications/the-plunging-price-of-thought
- Our arithmetic on the cited figures.